What cosmic rays revealed at the heliopause
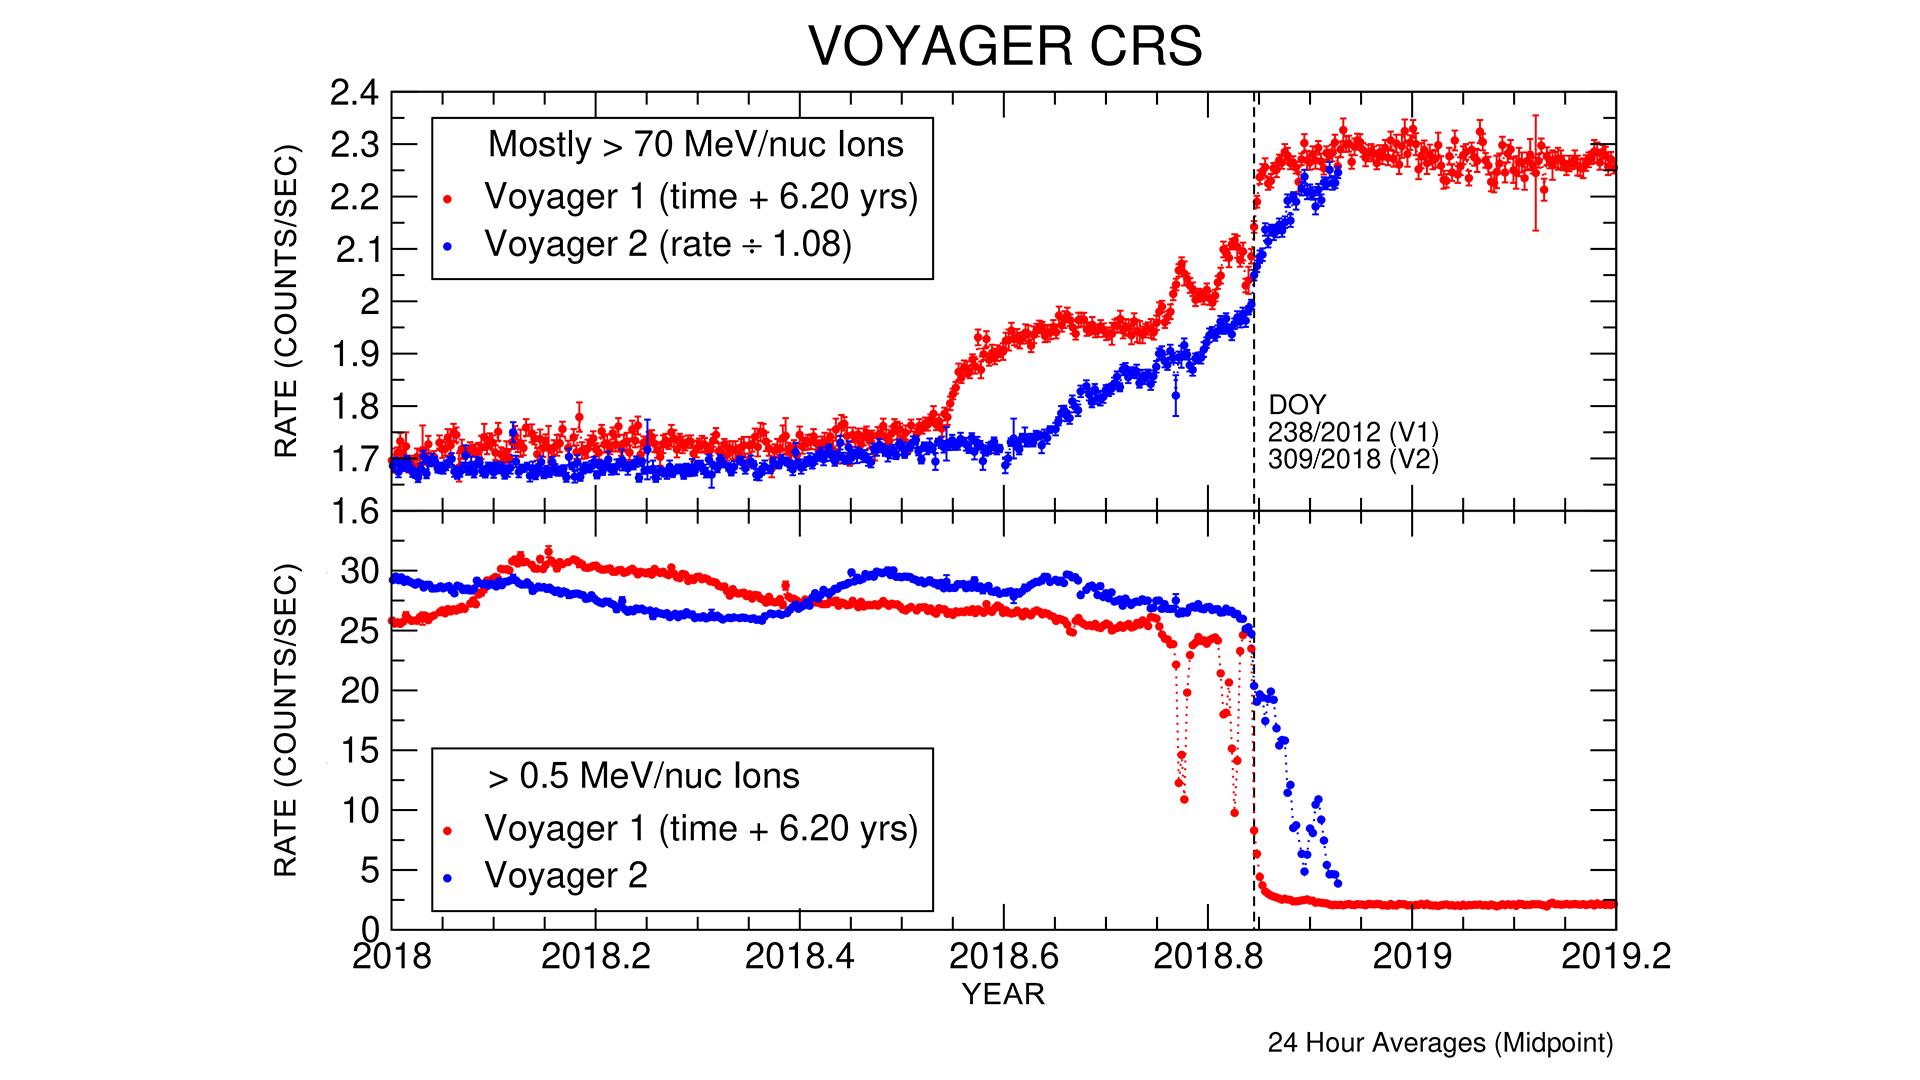
The Cosmic Ray Subsystem (CRS) counted energetic particles as each Voyager crossed the heliopause. Its historical measurements show a boundary in the particle environment, not a photograph of a physical wall.
Two populations of particles
High-energy galactic cosmic rays arrive from outside the heliosphere. Lower-energy particles on the chart originate inside the Sun's protective bubble. CRS measures how often these particles hit its detectors; the plotted count rate is not a direct measurement of distance.
What changes at the boundary
The upper graph shows an increase in galactic cosmic rays at each crossing. The lower graph shows a drop in lower-energy heliospheric particles. Voyager 1 recorded the transition in 2012, Voyager 2 in 2018. The patterns are similar, but their details differ because the probes crossed at different places and times.
How to read the evidence
The graph compares two historical encounters; it is not a live display of today's particle counts. Together with plasma and magnetic-field measurements, these changes helped the teams identify the heliopause. The boundary is a changing region, not a solid surface.